A basic understanding of the function of the human eye is essential to understanding imaging technology, especially when applied to color images. The printing process, the capture process, image compression, processing techniques, and OCR are all attempts to do, by machine, what the human eye does naturally. Scanners, printers, and monitors are all designed to fit human vision, its resolution and three-color perception.
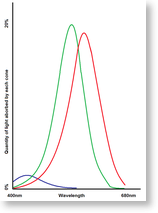
The human eye contains four types of light receptors; the rods, for general light sensing, and three types of cones that respond to different wavelengths of light, which we perceive as colors. This makes humans trichromats capable of seeing three dimensions of color. Other species’ eye’s differ; most mammals are dichromats, possessing rods and two types of cone, while many species of fish, reptiles, amphibians, birds, and even insects are thought to be tetrachromats, with four types of cones.

Human color vision responds to wavelengths of light from approximately 680 nm, a shade of red, to 400 nm, a shade of violet. The rods are relatively insensitive to light, absorbing from about 20% of the incoming red and green light, down to a mere 2% of the incoming blue light. The rods, which absorb wavelengths from 400 nm to 700 nm, are far more sensitive than the cones, but see only in shades of gray. There are around 100 million rods, and only 7 million cones in the eye; however, the fovea, which is the center of the visual field, contains almost all cones. This concentration provides humans with better color perception than most other trichromatic mammals.
The function of the eye tells us a couple of things. First, color is very important, as the central field of vision is geared to perceive color. Second, the existence of three types of cones in our eyes means that our eyes can be fooled into seeing most colors by simply combining different amounts of red, green, and blue light, rather than having to produce all possible wavelengths between 400 nm and 700 nm.
The first tells us why color imaging is important, and the second tells us how it works. There are two theories of color perception, both proposed in the 18th century, and both of which are useful for understanding and dealing with color image data. The first is the trichromatic or tristimulus theory, which states that the three types of cones are responsive to red, green, and blue light, and the opponent process theory, which states that the eyes interpret light as red vs. green, blue vs. yellow, and white vs. black. The trichromatic theory is why monitors mix red, green, and blue light in varying amounts to generate all the producible colors. The opponent process theory is why the YIQ colorspace used by NTSC television encodes information in the form of black/white, red/green, and blue/yellow components.
The trichromatic theory is the basis behind the RGB colorspace used in many imaging applications. Display hardware mixes red, green, and blue light in varying amounts to generate the image you see. This direct mapping to the display hardware makes RGB very convenient, and simple file formats, such as the Windows Bitmap, typically use the RGB format for storage as well. CMY and CMYK colorspaces are closely related to the RGB colorspace, but are targeted at print media, which is absorbent rather than emissive, and uses different primary colors. However, since these colorspaces are oriented towards the image display or printing hardware, they are not an intuitive means of dealing with color, nor are they ideal for various image processing operations.
The largest difference opponent process theory based colorspaces have is that they all put the black/white line parallel to an axis, where RGB places it at a diagonal. Since a change in brightness is perceived by more than one type of cone, due to the overlap in sensitivity, the black/white axis is the most important.
Take for instance the YIQ colorspace, used by broadcast television in North America through the advent of digital television. The Y represented the black/white axis, the I an orange/blue axis, and the Q a purple/green axis. When broadcast, the Y component gets 4 MHz of bandwidth, the I component gets 1.3 MHz, and the Q component gets only 0.4 MHz of bandwidth. This system was designed specifically to minimize the amount of bandwidth needed to add color, while preserving the visual quality of the previously used black and white television. The orange/blue axis gets a far greater portion of the bandwidth than the purple/green axis, because the eye is more sensitive to changes along the orange/blue axis than it is to changes along the purple/green axis.
The JPEG compression method uses a similar system, YCbCr, with Y being black/white, Cb being blue/yellow, and Cr being red/yellow; the Cb and Cr components are typically downsampled 2:1 spatially (i.e. a 200 dpi JPEG has 200 dpi Y and 100 dpi Cb and Cr) which results in an immediate compression of 50%, even before the application of the DCT compression.
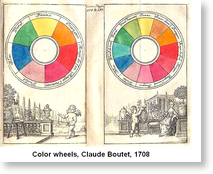
Artists color models are also useful in dealing with color images. The HSV color model is an artists’ model, with V (for “volume” or “value”), representing the black/white axis, H representing the hue, and S representing the saturation, and is typically represented as a cone. This model dates back to the 18th century, and has been used by artists since, as it provides an easy means of understanding how basic colors are blended to generate a desired color.
Starting with a color on the perimeter of the base of the cone, white can be added to reduce the saturation, moving the color in towards the center, and black can be added to reduce the brightness, moving the color towards the point. In addition to providing an intuitive method for dealing with color, this property is also useful when dealing with scanned images, because the interaction between zones of color, black text, and white paper will result in changes in saturation and brightness, but remain a constant hue.


